My first startup was called Lucision. Thats Lucid + Decision.
(Never name your startup something weird or clever unless it rolls off the tongue. It was like naming a kid Soda Pop. If you don’t know what I mean, go listen to A Boy Named Sue. Nobody could remember or pronounce ‘Lucision,’ and I suffered misunderstanding on sales calls for two years because of it.)
In its first iteration, Lucision aimed to turn court cases into decision trees or state diagrams. Most legal cases are predictable, boilerplate stuff, so firms handle many at once, can’t remember them, and have to recreate the state of each in their head when they work on them. A lawyer friend sketched out a state chart of an eviction on a napkin at the Disco Diner in Atlanta at 2AM, and I was sold. I spent a lot of time in legal libraries and I took a job doing IT for her law firm while working for my father building the farmhouse I would later live in. I saved up money, and moved to Goa to focus on building a hot prototype. I was a Perl hacker and had some bad habits, so it was fortunate that a computer science PhD was living next door. We became friends, and he tutored me. I read Design Patterns (and later recovered from it) and Object Oriented Analysis and Design, and built a graph-based document management system using Eclipse.
Two years ago a friend gave a presentation on Cascading and Hadoop, and why I should care. He convinced me. I read the PigPen paper and decided to productize it with WireIT. Thats when I realized I was into graphs in a big way.
I learned graph theory and read up on network flows. I learned graph layouts. I solved analytic problems with interactive graphs in Processing. Graphs, graphs, graphs! I became obsessed with the Wonder Wheel.
Which brings us full circle to yesterday, where I think I identified a design pattern: Data-Driven Recursive Interfaces.
Step 1) Create interesting, inter-connected records. This is your problem, but if you look at it the right way your data is probably a graph. Most interesting data is. I like to use Hadoop, Pig and Python to do this. Shrink the big or medium data into summaries you can serve for people to consume directly.
Step 2) Store these records as objects in a key/value store, like so:
key => {property1, property2, links => [key1, key2, key3]}
Split records as properties increase and become complex to avoid deep nesting. Or go at it as a document. Both approaches are valid if they fit your data.
Step 3) Use a lightweight web framework like Sinatra to emit the key/value data as JSON, or use a key/value store that returns JSON in the first place.
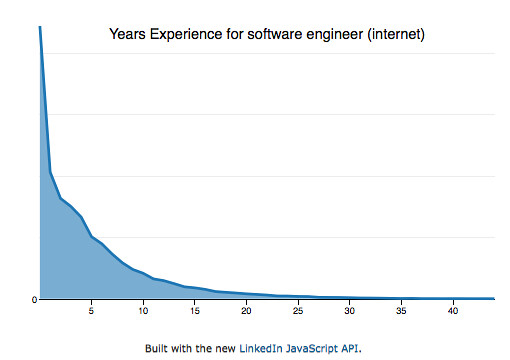
In Ruby/Sinatra with Voldemort, generating JSON to go directly in a protovis chart looks like this (leave my Ruby alone):
get ’/experience/:title’ do |title|
experience = experience_client.get(title)
values = []
experience['by_years’].each do |i|
values << {'x’ => i['start_years’], 'y’ => i['total’]}
end
JSON.generate(values)
end
Step 4) Construct a single, light-weight interface, that renders the keys into HTML/JS. Use visualization: Protovis, Raphael, ProcessingJS, etc. Add HTML links between records.

Result: Using batch processing, a key/value store, and light web and visualization frameworks… you made one simple type of record and an interface for it that enables endless exploration. I call that tremendous bang for the buck, and the technology stack helps you along the way. It is opinionated, as though this is the kind of thing you are supposed to be doing because there is such little impedance between the model and view.
In contrast to relational database systems, Hadoop and NoSQL facilitates graph centric interfaces and enable graph-centric exploration and thinking.
A record in a table is no longer the base unit. Tables aren’t real. Graphs are real. Take note.

